
 Vendor Portal
Author: Mark Ainely | Partner GC Realty & Development & Co-Host Straight Up Chicago Investor Podcast
Recently on the Straight Up Chicago Investor podcast, we had Jason Wagner from Greystone Realty on to break down the current state of the Chicago market for investors. Jason knows this city cold, and one of the things he highlighted really stuck with me: rent growth, and specifically how uneven it has been from one neighborhood to the next. Want to watch the full episode? Check it out here.
Some pockets of Chicago are posting rent growth numbers that would make any investor look twice. Others are barely moving. That gap is exactly where opportunity lives, so I wanted to take the data Jason shared and elaborate on it here.
Big thank you to Jason for pulling this together. All of the numbers below come from his research (sourced from Rentometer), and I will show you how to get more of it directly from him at the end of this article.
Key Takeaways
Rent growth across Chicago is wildly uneven, ranging from roughly 6.5% on the low end all the way up to 29.7% year over year.
Grand Boulevard on the South Side led the entire list at 29.7% growth with an average rent of $1,794.
On the West Side, West Garfield Park led at 22.2% growth, even though its average rent of $1,525 sits well below pricier areas like Lincoln Park.
High growth does not always mean high rent. Several of the fastest growing areas still carry below average rents, and that is often where hidden value shows up.
All of this data comes from Jason Wagner at Greystone Realty. You can sign up for his ongoing market updates, the Wagner Report, using the link further down.
What Jason Shared: Rent Growth by Neighborhood
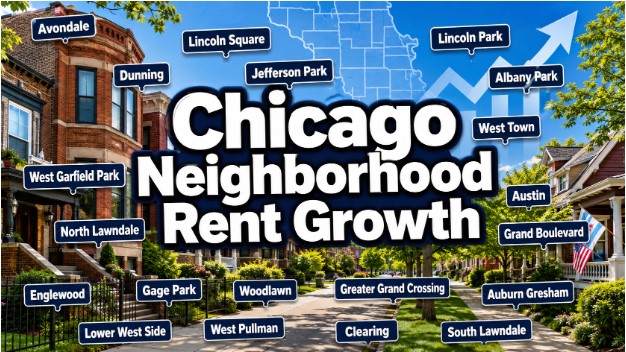
Here is how the top performers shook out across the North Side, West Side, and South Side.
North Side
| Neighborhood | Annual Rent Growth | Avg Monthly Rent |
|---|---|---|
| Avondale | 20.0% | $2,046 |
| Dunning | 19.5% | $1,754 |
| Lincoln Square | 13.6% | $2,324 |
| Jefferson Park | 9.4% | $1,778 |
| Lincoln Park | 8.7% | $2,933 |
| Albany Park | 8.3% | $1,823 |
| West Town | 7.3% | $2,247 |
West Side
| Neighborhood | Annual Rent Growth | Avg Monthly Rent |
|---|---|---|
| West Garfield Park | 22.2% | $1,525 |
| North Lawndale | 18.1% | $1,575 |
| Austin | 9.2% | $1,367 |
South Side
| Neighborhood | Annual Rent Growth | Avg Monthly Rent |
|---|---|---|
| Grand Boulevard | 29.7% | $1,794 |
| Englewood | 15.0% | $1,333 |
| Gage Park | 14.6% | $1,340 |
| Woodlawn | 14.0% | $1,510 |
| Greater Grand Crossing | 11.4% | $1,402 |
| Auburn Gresham | 10.0% | $1,397 |
| Lower West Side | 8.3% | $1,766 |
| West Pullman | 8.1% | $1,410 |
| Clearing | 7.7% | $1,195 |
| South Lawndale | 6.5% | $1,438 |
What This Actually Means for Investors
A few things jump out at me when I sit with this list.
First, the headline number. Grand Boulevard posting 29.7% growth is enormous. That is the kind of move that gets people excited, and there are real reasons behind the momentum in that part of Bronzeville, including its lakefront proximity, transit access, and steady development interest. That said, I always tell investors to treat a single year of growth as a signal to dig deeper, not as a green light. A big percentage can sometimes reflect a lower starting base or a handful of new lease comps, so you want to verify it against your own numbers before you get married to a market.
Second, growth and price tell two completely different stories. Lincoln Park has the highest average rent on this entire list at $2,933, yet its growth was a modest 8.7%. That is exactly what you would expect from a mature, stable, high demand neighborhood. Compare that to West Garfield Park at 22.2% growth on a $1,525 average rent. Those are two very different investment profiles, and neither one is automatically better. It comes down to your strategy, your risk tolerance, and how hands on you want to be.
Third, do not sleep on the areas with strong growth and below average rents. Neighborhoods like Englewood, Gage Park, and Woodlawn are all posting double digit growth while still sitting at rents in the $1,300 to $1,500 range. That combination can point to appreciation potential, but it also usually comes with more operational reality: tighter tenant screening, more attentive management, and a real plan for turnover. This is where having the right team behind you matters most.
The one caution I will repeat is that this is a snapshot in time. The data is sourced from Rentometer and, as Jason notes, is deemed reliable but not guaranteed. Use it as a starting point for your research, not as your entire buy decision.
Keep Reading
Want to go deeper on where the Chicago market is heading? Start with these:
Chicago Rental Inventory Trends: What the Latest Numbers Are Telling Investors
What GC Realty's 2026 Leasing Data Reveals About the Chicago Market
Want More of This Data? Get the Wagner Report
If this kind of neighborhood level market intelligence is useful to you, Jason puts out ongoing updates through something he calls the Wagner Report. It is a straightforward way to keep a pulse on where the Chicago rental market is heading without having to dig through the data yourself.
You can sign up for the Wagner Report here: https://reagentinsights.com/report-signup/EJnjk5CesqXrxzpS20m0HzXwQRW2
And if you want to hear Jason walk through the current market in his own words, go check out his episode on the Straight Up Chicago Investor podcast.
FAQ
Where did this rent growth data come from? The numbers were compiled by Jason Wagner at Greystone Realty and are sourced from Rentometer. The data is deemed reliable but not guaranteed, so always confirm against your own comps before making a decision.
Does high rent growth mean I should buy in that neighborhood? Not on its own. Rent growth is one useful data point, but a smart investment decision also factors in price, cash flow, condition, tenant demand, management intensity, and your long term goals. One metric is never a strategy.
Why is average rent so different from the growth rate? Growth measures how much rents moved over the past year, while average rent tells you the actual dollar amount. A neighborhood coming off a lower base can show a huge growth percentage while still having relatively affordable rents, and a premium neighborhood can show slower growth while still commanding the highest rents in the city.
Is the North Side always more expensive than the South Side? Generally the North Side carries higher rents, but this data shows plenty of overlap. Grand Boulevard on the South Side, for example, posted both the strongest growth on the list and an average rent higher than several North Side neighborhoods.
How often does this data change? Rental market data shifts constantly. That is exactly why signing up for the Wagner Report is worth it if you want to stay current without doing all the legwork yourself.
Don't Go At This Alone!
At GC Realty and Development, our team manages approximately 1,500 units across Chicagoland for more than 500 private investors. Whether you own one property or fifty, we handle leasing, maintenance, rent collection, compliance, and everything in between, so you can focus on growing your portfolio instead of chasing tenants and contractors.
My mission is simple. I want to help Chicago investors and housing providers build real, lasting wealth through real estate without letting the daily grind of operations take over their lives. I have spent more than two decades in this business, I have rehabbed over 500 units, and I built GC Realty from the ground up, so I know firsthand what it takes to protect your investment and actually grow it.
Here is something else worth sitting with. When rent growth is running this strong, the numbers on holding a property often beat the numbers on selling it. If you have a home you were planning to put on the market, a stretch like this may be the moment to turn it into a rental instead and let that rent growth work in your favor. If that is even a maybe for you, we can help on either end. If you just want us to find and screen a great tenant while you keep running the day to day yourself, that is our Tenant Placement service. If you would rather hand off the whole thing and never think about a leaky faucet again, that is our full service Property Management.
If you are trying to figure out where to put your next dollar in this market, or you just want a property management partner who treats your investment like their own, we would love to talk.